The Art of Not Losing: Professional Risk Management for Active Investors
In the collective imagination, success in financial markets is associated almost exclusively with the ability to predict the future: finding the next stock that will multiply in value, anticipating the exact turn of a currency, or deciphering the next macroeconomic movement. However, in institutional trading floors and among the most respected hedge fund managers in the world, the mentality is radically opposite. Professionals do not focus on how much they are going to earn; their absolute obsession is determining how much capital they are willing to lose if their investment thesis is wrong.
Trading and active investing are not games of certainty, but of mathematical probabilities. No matter how robust a technical or fundamental analysis may be, the financial market operates in an environment of intrinsic uncertainty where any geopolitical event, an unexpected earnings report, or a massive algorithmic order can invalidate a scenario in milliseconds.
Mastering the art of not losing does not mean avoiding losing trades—losses are an inevitable operational cost in this business—but rather structuring a mathematical system of damage control that ensures no losing streak can destroy your wealth. Below, we break down the pillars of professional risk management.
1. The Mathematical Asymmetry of Losses: The Deep Hole
The first concept every active investor must understand is that lost money does not recover in a linear relationship. Due to the mathematical nature of percentages, recovering lost ground requires exponentially greater effort from the remaining capital.
When a portfolio experiences a capital reduction (drawdown), the mathematical base upon which subsequent returns are calculated shrinks. Let’s analyze the following scale of wealth degradation:
-
If you lose 10% of your account, you need the remaining capital to generate 11.1% return just to return to the original breakeven point.
-
If you allow the loss to reach 25%, the required return to recover rises to 33.3%.
-
If you suffer a 50% loss, the capital you have left must experience 100% return (double) simply to recover what you had at the start.
-
If the loss reaches 75%, you need 300% return just to break even.
This asymmetry demonstrates that allowing a single trade to suffer an uncontrolled decline is not a tactical error; it is financial suicide. The goal of risk management is to keep losses strictly limited to the first level (small losses), where mathematical recovery is extremely simple and viable in the next sequence of trades.
2. The 1% Rule: The Shield of Survival
One of the most powerful and simple tools to protect an investment account is the 1% Rule (or 2% as an absolute maximum). This rule stipulates that under no circumstances should an investor risk more than 1% of the total value of their net capital in a single trade.
It is fundamental to distinguish the difference between position size and capital at risk:
-
Position size: It is the total value of the asset you are acquiring (for example, buying shares of a company worth $10,000).
-
Capital at risk: It is the real and maximum loss you will incur if the price moves against you and hits your predetermined exit level (for example, if you decide to exit the trade when the position loses $100).
If an investor has an account of $10,000, 1% equals $100. This means that if the trade fails, the account will drop to $9,900. Under this strict structure, the investor would have to string together an implausible streak of 50 consecutive losing trades to see half their capital destroyed. The 1% Rule transfers control of the game from the hands of the market to the hands of the investor, guaranteeing survival through the most adverse streaks.
3. Stop Loss and Position Size Calculation
The premier operational instrument to execute the art of not losing is the Stop Loss (loss-stopping order). A Stop Loss is not a suggestion; it is an automated and non-negotiable order placed on the platform that liquidates the position immediately when the price touches a specific level, cutting the loss at its root.
The professional calculation of position size is not done randomly or by intuition. It is determined by a fixed mathematical formula based on the distance of the Stop Loss and the maximum allowed risk:
Position Size = Capital at Risk (e.g., 1% of account) divided by Distance to Stop Loss (Entry Price - Stop Price)
Practical Example:
Imagine you have an account of $20,000. Your maximum risk per trade is 1% ($200).
-
You analyze a stock trading at $100.
-
Your technical analysis indicates that if the stock falls below $95, the uptrend will have been invalidated. Your Stop Loss level is $95 (the distance is $5 per share).
-
Applying the formula: We divide your maximum risk ($200) by the distance to Stop Loss ($5). The result is 40.
For this trade, you must buy exactly 40 shares. If the price rises, you capture the return; if the price falls and touches $95, your platform will automatically sell the 40 shares, registering an exact loss of $200. Your account will be perfectly safe, ready for the next opportunity.
4. Mathematical Expectancy and Risk/Reward Ratio
For an active investment system to be profitable in the long term, it must possess a Positive Mathematical Expectancy. This means that the combination of your win rate (how many trades you win vs. how many you lose) and your risk/reward ratio must yield a net positive balance after hundreds of executions.
The risk/reward ratio (R:R) is the proportion between what you are willing to risk versus the potential gain you seek to obtain. Professionals seek positive asymmetric ratios, ideally 1:2 or 1:3.
1:2 Ratio: For every dollar you risk, you seek to gain two.
1:3 Ratio: For every dollar you risk, you seek to gain three.
The impact of an asymmetric risk/reward ratio on a portfolio’s viability is massive. Let’s analyze a scenario under a 1:3 ratio executing 10 trades:
If your analysis is so poor that you lose 7 trades and only win 3 (a win rate of just 30%):
Despite having failed the vast majority of the time, the system remains profitable. Professional risk management demonstrates that you don’t need to be right all the time to build solid wealth; all you need to do is ensure that when you lose, you lose little, and when you win, you win big.
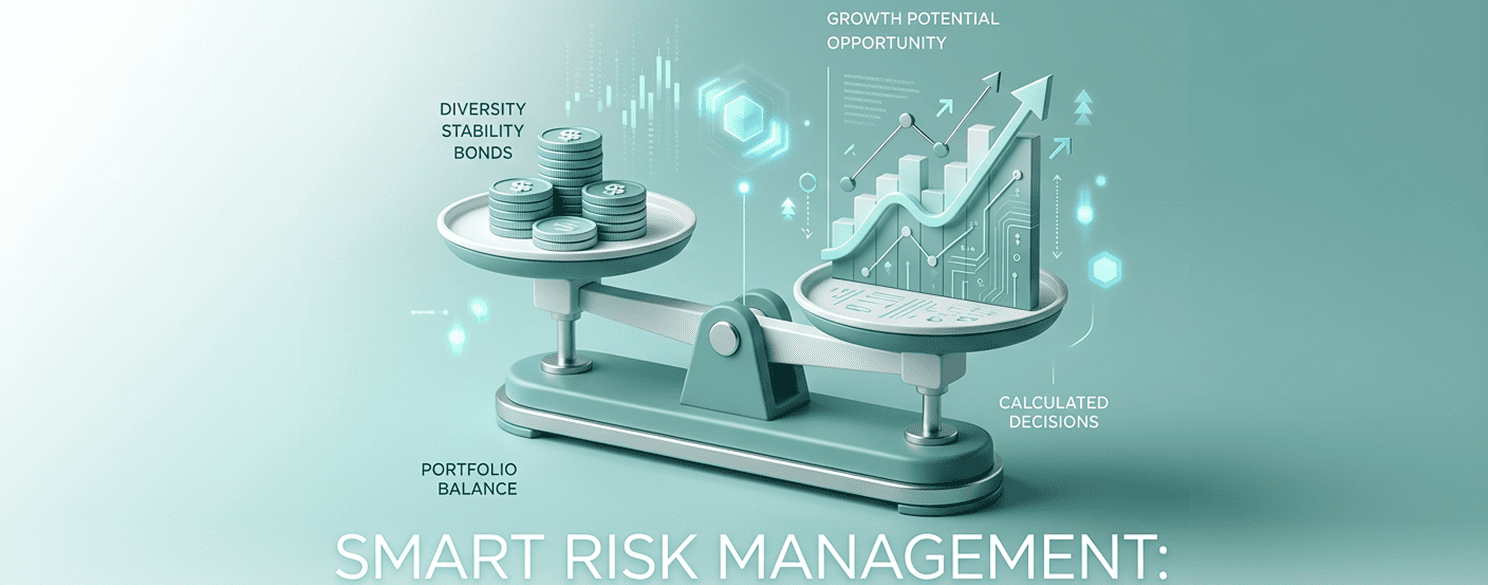
5. Correlation Risk: The False Diversification
An advanced mistake many active investors make is neglecting asset correlation. Correlation measures the degree of dependence or similarity in price movement between two or more financial instruments.
If an investor opens five simultaneous buy trades, risking 1% in each, in five different stocks but all belonging to the high-cap technology sector, that investor is operating under an illusion of diversification. In practice, if the technology sector suffers a correction due to a global macroeconomic data point, all five stocks will fall in unison. The investor will not have risked 1%, they will have risked 5% of their account in a single sectoral idea.
True diversification in risk management requires that active positions be distributed across assets that respond to different economic dynamics (for example, combining a position in the technology sector with another in defensive commodities, and another in short-term fixed income). Monitoring and limiting aggregate risk by sector, currency, or asset class is the final layer that shields a professional portfolio against black swans or systemic market shocks. The true art of active investing does not lie in the speed of acceleration, but in the quality and firmness of the brakes.